
Comparing Risk and Return
Comparing Risk and Return for Pensions & Investments
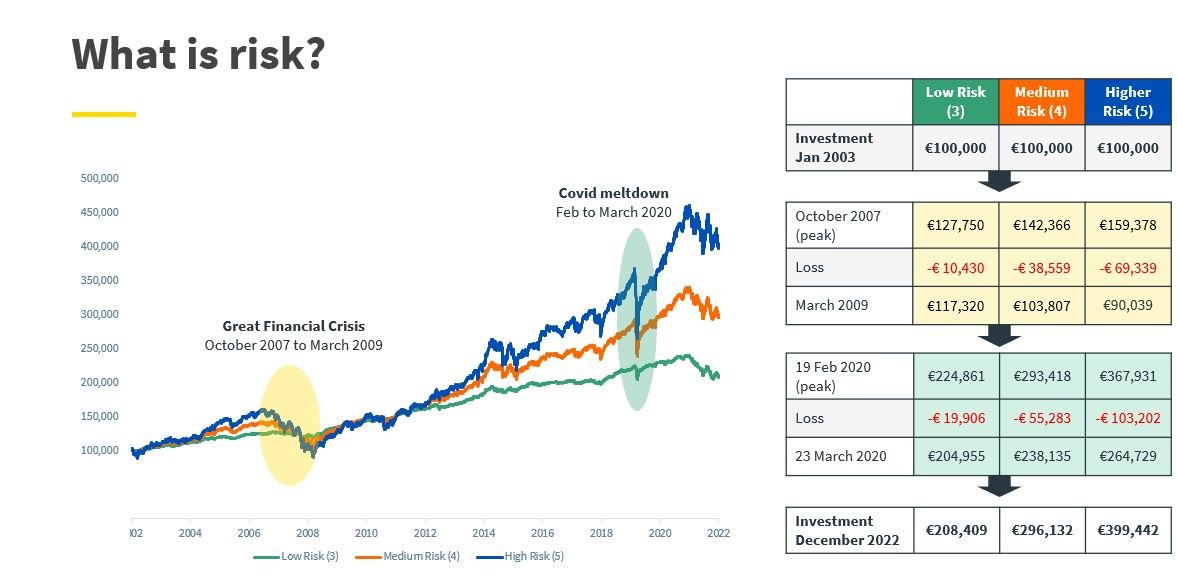
The chart above illustrates the real returns generated by funds of different risk categories over the same time period, showcasing the same investment. Specifically, the chart tracks the return based on funds rated 3, 4, and 5 on the ESMA risk scale, from January 2003 to December 2022.
You can see, during the market crashes in October 2007 and March 2020, the higher-risk investor incurred the largest losses. Typically, higher risk funds expose you to higher short term losses in exchange for higher long term return. In October 2007, investors had only four years of returns to cushion their losses, and the high-risk investor held the lowest value. By March 2020, the high-risk investor had enough returns to absorb the loss of the market downturn, now holding the highest value depsite a loss of €103,202. And by the end of 2022, the high-risk investor had earned substantially higher returns than their medium- and low-risk peers.
While short-term market fluctuations can be unpredictable and even dramatic, long-term investors who weathered these fluctuations have been rewarded with strong returns. It is essential to note that market returns are not guaranteed, and individuals should carefully consider their time horizon, (the time they plan to remain invested). For instance, someone nearing retirement or with savings that they may need short-term access to, is not to be considered a long-term investor. When investing, clearly outline your investment goals with your advisor.
It is important to note that the investors referred to in the chart all "stayed the course" and remained invested in the same fund through the highs and lows. Investors who may have started in a higher risk fund and moved funds when the market took a dip will not see the same return as those who remained invested.
“The stock market is a device for transferring money from the impatient to the patient” Warren Buffet
*Chart Source; Aviva Investors as at 31 December 2022
Low Risk is 20% Global Equities/80% Global Bonds in euro. Medium Risk is 50% Global Equities/50% Global Bonds in euro. Higher Risk is 80% Global Equities/20% Global Bonds in euro. All rebalanced daily, based on index returns, gross of fees and costs
Any queries on the above, do not hesitate to get in touch.
Rachel O’ Shea, QFA
Senior Consultant & Protection Manager